How Fragile Are Your Clickstream Analytics?

You guessed it—the tags were dropped. Again!
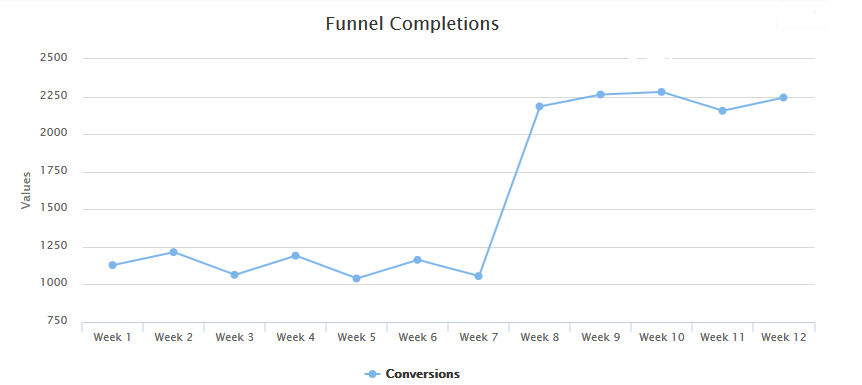
OK, this first one was easy, and chances are if you happened to look at this chart a few weeks in, you would have caught it. How about this one:
Is it:
A: Break out the champagne! The new site redesign is the bomb!
B: A gnawing suspicion that somehow the new site is double-counting.
The Post-Mortem of a Data Collection Lapse
You did everything right—collected business requirements, translated them into tagging specifications, worked tirelessly with your devs or your tag management system to implement and QA the tracking, built your metrics and dimensions... checked everything twice. And still, here you are, facing the complete desolation of data loss, or worse, the utter confusion of garbage data.How often do these two beasts rear their ugly head? Once a year, once a month, with every sprint or release? Do you spend countless hours trying to extrapolate or adjust data, then have to spend those hours again when you do your YoY, MoM, WoW analyses?
It turns out you are not alone.In 2014, a vendor-sponsored event voted on a set of practical tips and tools, selecting the winning presentation--an Excel-based regression model for extrapolating lost data.
A recent blog post about the June 2015 Adobe Analytics release describes creative ways of adjusting data through calculated metrics. Data that is suffering from the same tags-gone-wild syndrome.For all this talk of winning and creativity, it sounds like we’re losing the battle against data glitches, doesn’t it?
A Fresh Approach to Identifying Data Collection Issues
Not so fast. There’s now a solution that can help you identify calamities as they happen, and not weeks or months later.And no, it’s not one of those hotshot monitoring services that hammer every single page on your website only to tell you that your generic tag was found on 98% of the pages, and charge you an arm and a leg for it. It’s a precision tool that can be aimed at the crucial user flows driving your KPI. Those same KPI you share with your C-Suite that you’re having to asterisk again and again.
This is not a tool coming from the legacy QA world, either. Legacy QA software is admittedly flexible and robust, but you have to spend so much time and IT resources configuring tests, that it’s hard to keep up with the modern development pace of a website.
Automated Intelligent QA of Multiple Sites
In building this solution, we followed a few simple principles:
- The QA of tags that drive your KPI should be intelligently automated.
- You will want to be notified as soon as one of these tags goes missing, or gets doubled, or changed in some other unintended way.
- You should be able to easily create and modify automated tests using only a browser (no server farms, browser plugins, or computer science degrees required).
- Sites with complex purchase funnels, dynamic menus, multiple forms, conditional and positional content, cross-domain iframes, are the new norm. Automation should be able to handle all key aspects of the modern web and modern web analytics tracking.
We believe we were successful in building exactly this kind of tool.
Sounds too good to be true? Request a demo and see if you’re up for a free trial.