Audit Scores in Adobe Analytics
 |
 |
 |
It is the highest grossing month for your e-commerce website. Revenue and Product Views are at an all time high. You get an email from one of your analysts asking you to take a look at "Cart Additions" - this metric seems to be lagging behind. You find out that the "Add to Cart" button was tweaked a few days ago and the tag that tracks it is now broken.
You switch into damage control mode - you or your dev team fix and test the tag. You send out an email alerting analysts about the inaccuracy of the "Add to Cart" metric over the affected time period. The analysts communicate it with their teams ... and another black mark has been notched against your analytics solution. Even worse - you are now dealing with eroding confidence in the quality of the data as well as inhibited decision making because of faulty data.
You are not alone - this scenario is typical across organizations. And how can it be any different - with hundreds of custom data points, the chances are that this will happen often. We have written before about the fragility of tagging implementations and how you can use QA2L to counteract it with user-specified flows that automate tag audits across your site's key journeys. These automated audits will trigger alerts and you will be the first to know when unexpected changes happen.
Today, however, we'd like to evolve the idea of integrating these audit results in your Adobe reports in addition to sending alerts to your inbox.
What are the benefits of making audit scores available directly in your reports?
- Your analysts will have a direct gauge for the quality of the data as they work with the data. No longer would your colleagues need to ask if the the metric is correct. The audit results will be right in front of them telling them that a metric passed 7 of the 7 audits for the that week, or that a dimension started failing its audits after the 29th day of the month.
- The score in Adobe Analytics would get updated real time as the audits take place, presenting the analysts with a living history of what the audit score is at different times for different reports. As a result, when dealing with historical data (that has been audited) analysts will know if they are any necessary adjustments for tagging insufficiencies they need to account for without having to reference history of emails or JIRA tickets where issues such as these are usually documented.
- Perhaps the greatest benefit, however is that the quality of the data will be consistently and objectively communicated on a company level. It is a fundamental change in the perception of tagging quality. Data quality becomes a KPI in itself, a metric that is tracked over time with the potential to build a strategy around addressing the reasons that lead to gaps in tagging quality.
- The audit score should be specific, indicating the report suites and variables that were audited (eVars, props, events).
- For the audit score to be meaningful, it should represent checks against user-specified rules, not indiscriminate checks. In other words it is not enough to capture that event1 is triggered, it is important to capture that event1 is triggered in the correct flow, at the correct time/step/user interaction. In the context of evars/props, the variable in question should be checked against a specified range of user-provided values, issued in the correct flows.
- The audit score should contain additional information allowing you to trace the source of potential errors. As such the site journey and step name should be captured along with the specific variable that is audited. To illustrate with an example, if eVar1 is set on the page where the user has provided a search term in the "OnSite Search" flow, the result that should be captured would look like this: "OnsiteSearch:SearchTermProvided:eVar1".
- The audit score should be configurable with options to write data to a dedicated report suite, spread across existing report suites, or both.
- In the context of audited dimensions, the quality score could be presented as a dimension line item, eliminating the need to reference a different report or report suite.
- SAINT classifications could be used to translate the raw evar/event/prop number into the business friendly Dimension/Event name.
1. A separate report suite the serves as a data quality scorecard and gives you the audit score for each of your report suites at a glance :

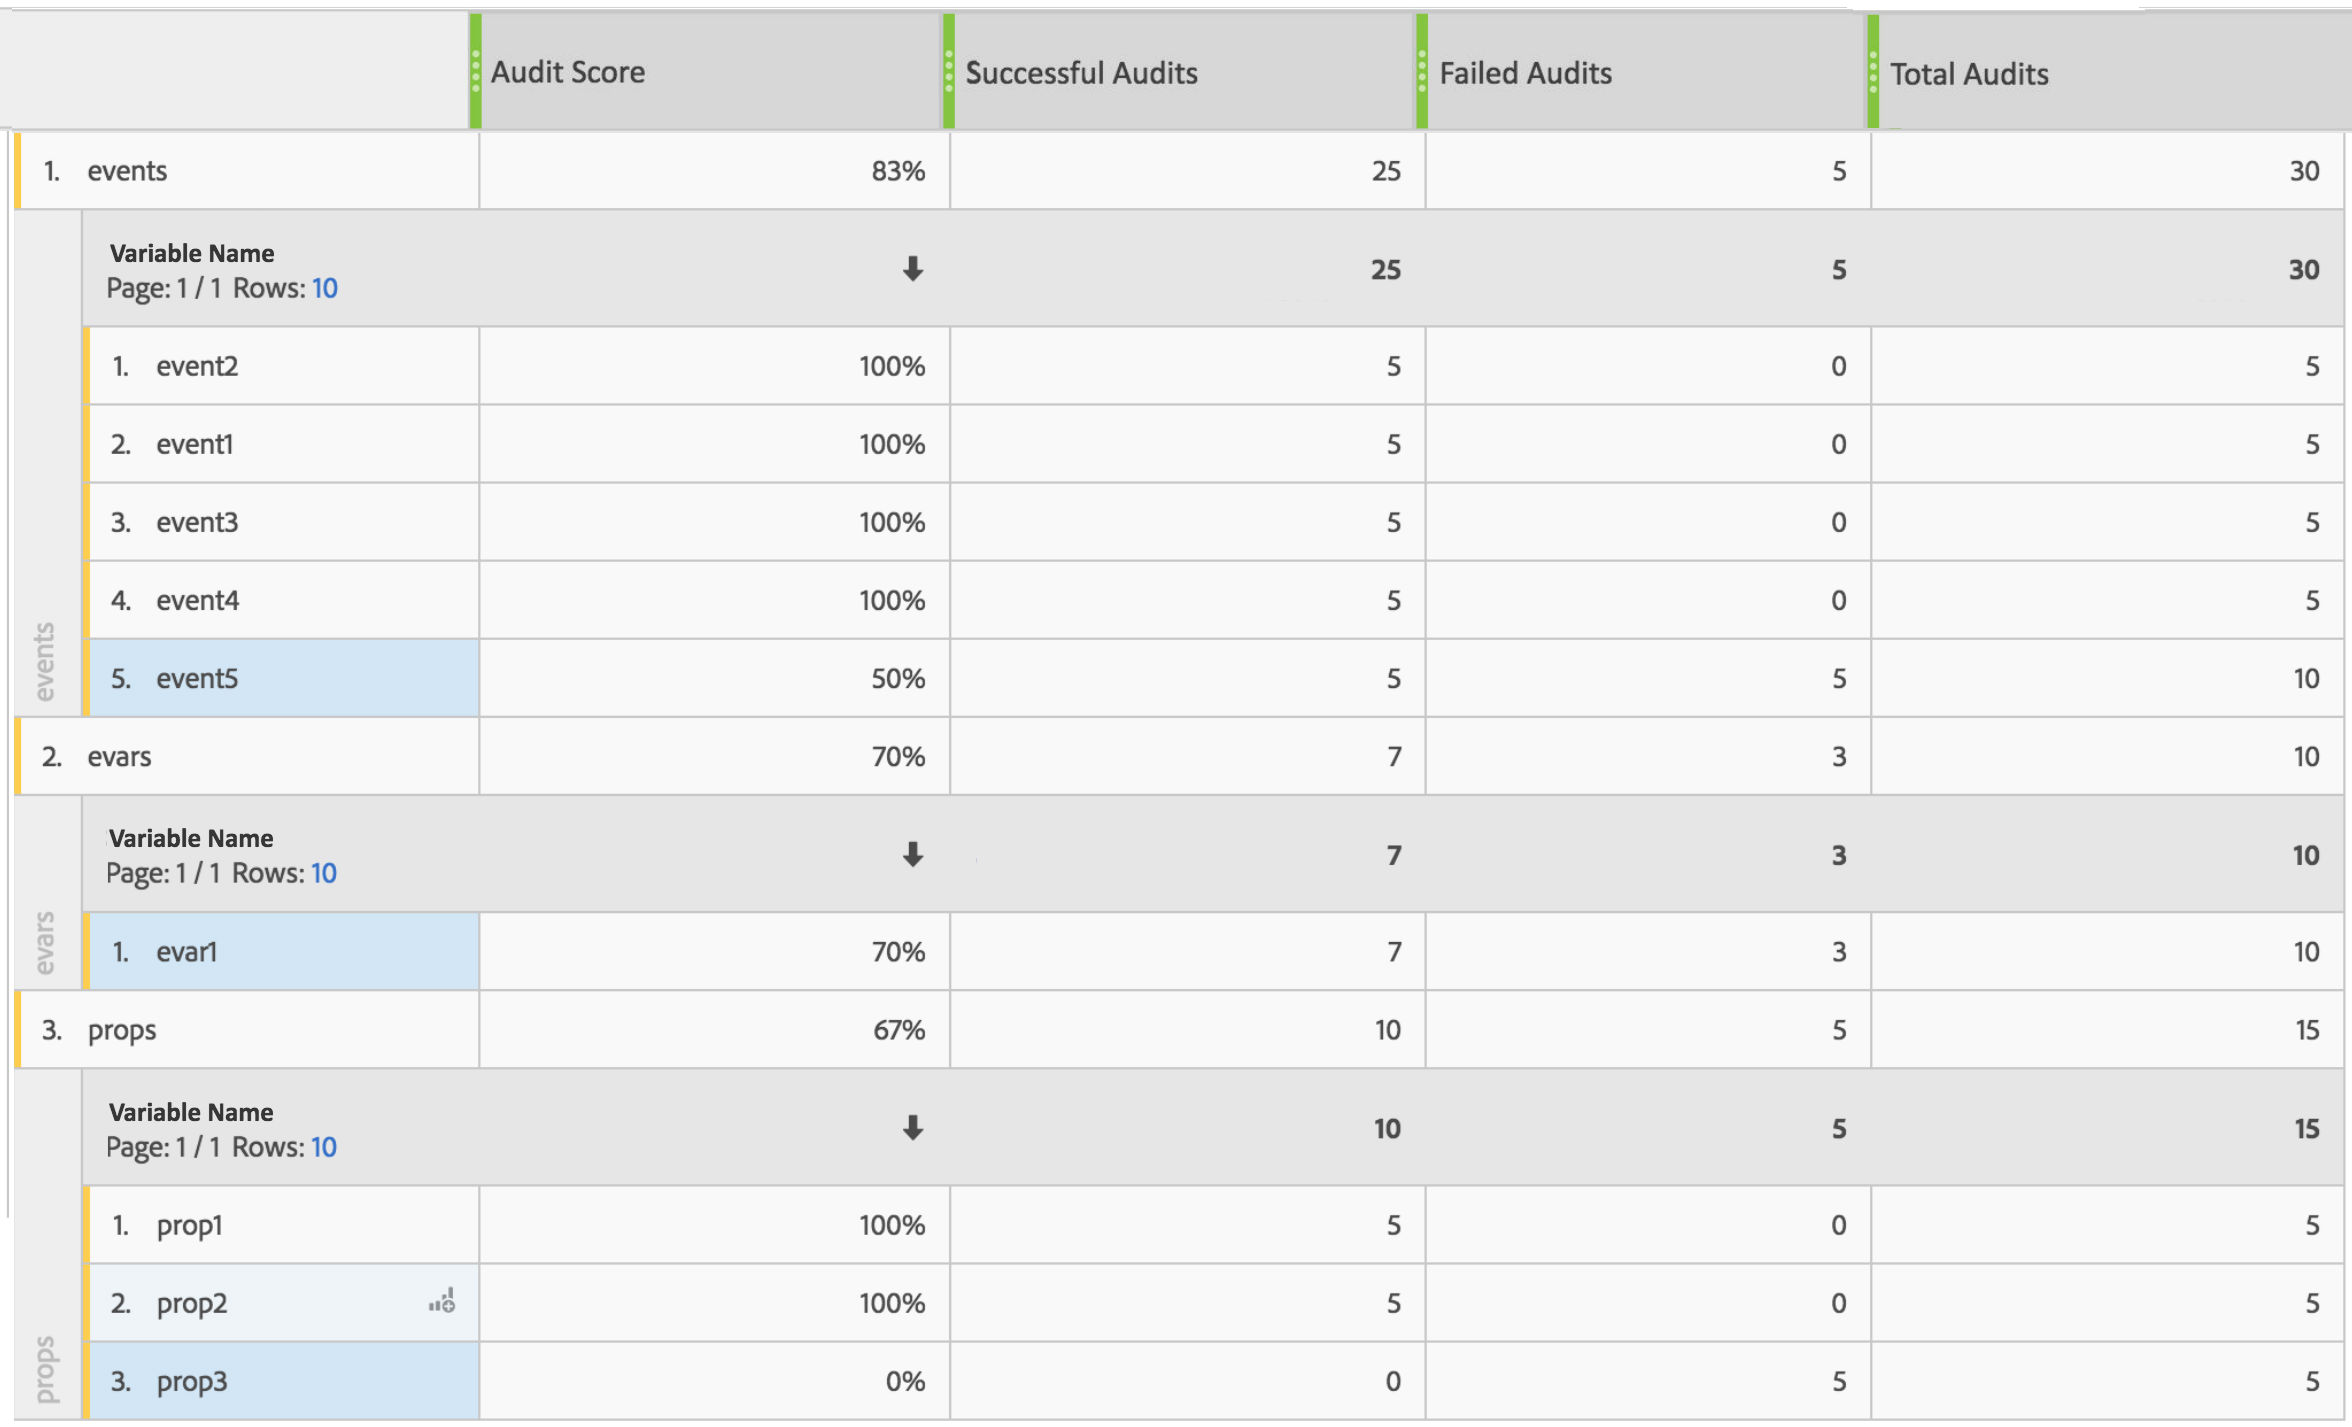
2. With the ability to see the audit information broken out by variable type:

3. And to further examine each variable:
In the sample below, one can easily see that the quality score is lowered by three individual variables:
- event5
- evar1
- prop3

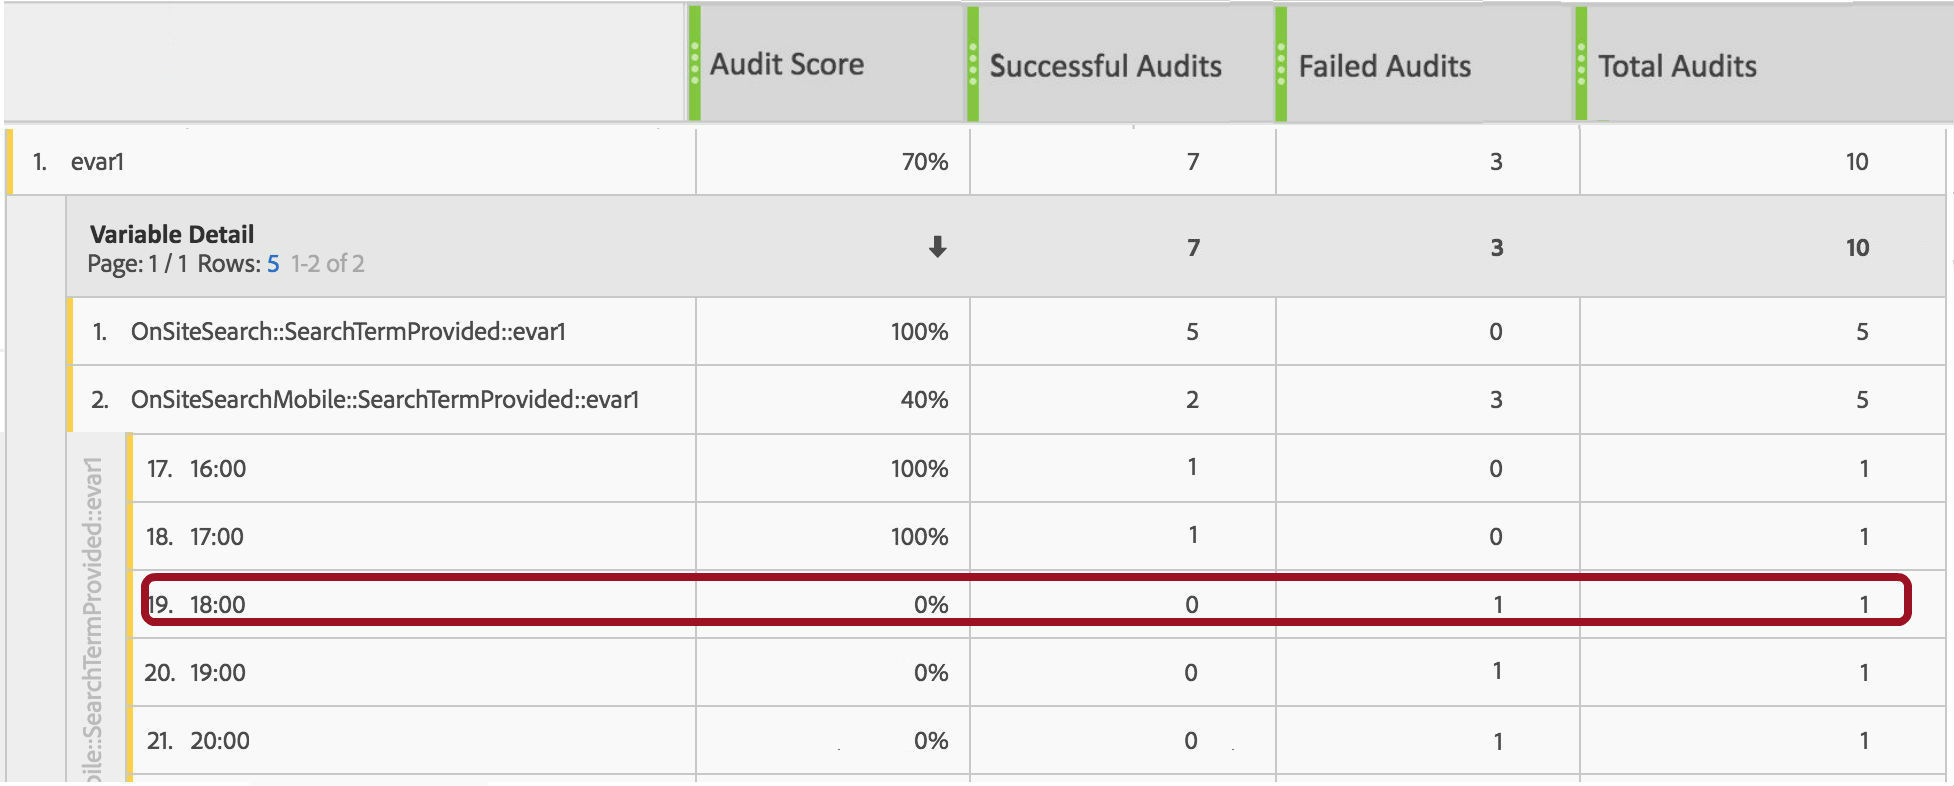
4. Focusing on eVar1, we can see that the variable is correctly set on the desktop-facing website, but the mobile-optimized pages are causing the audit for this eVar to fail. We can also tell that the failure is occurring on the step where the user has provided a keyword within the OnSite Search Mobile Flow.

5. Moreover, we can tell that the first failure occurred at 6 pm:

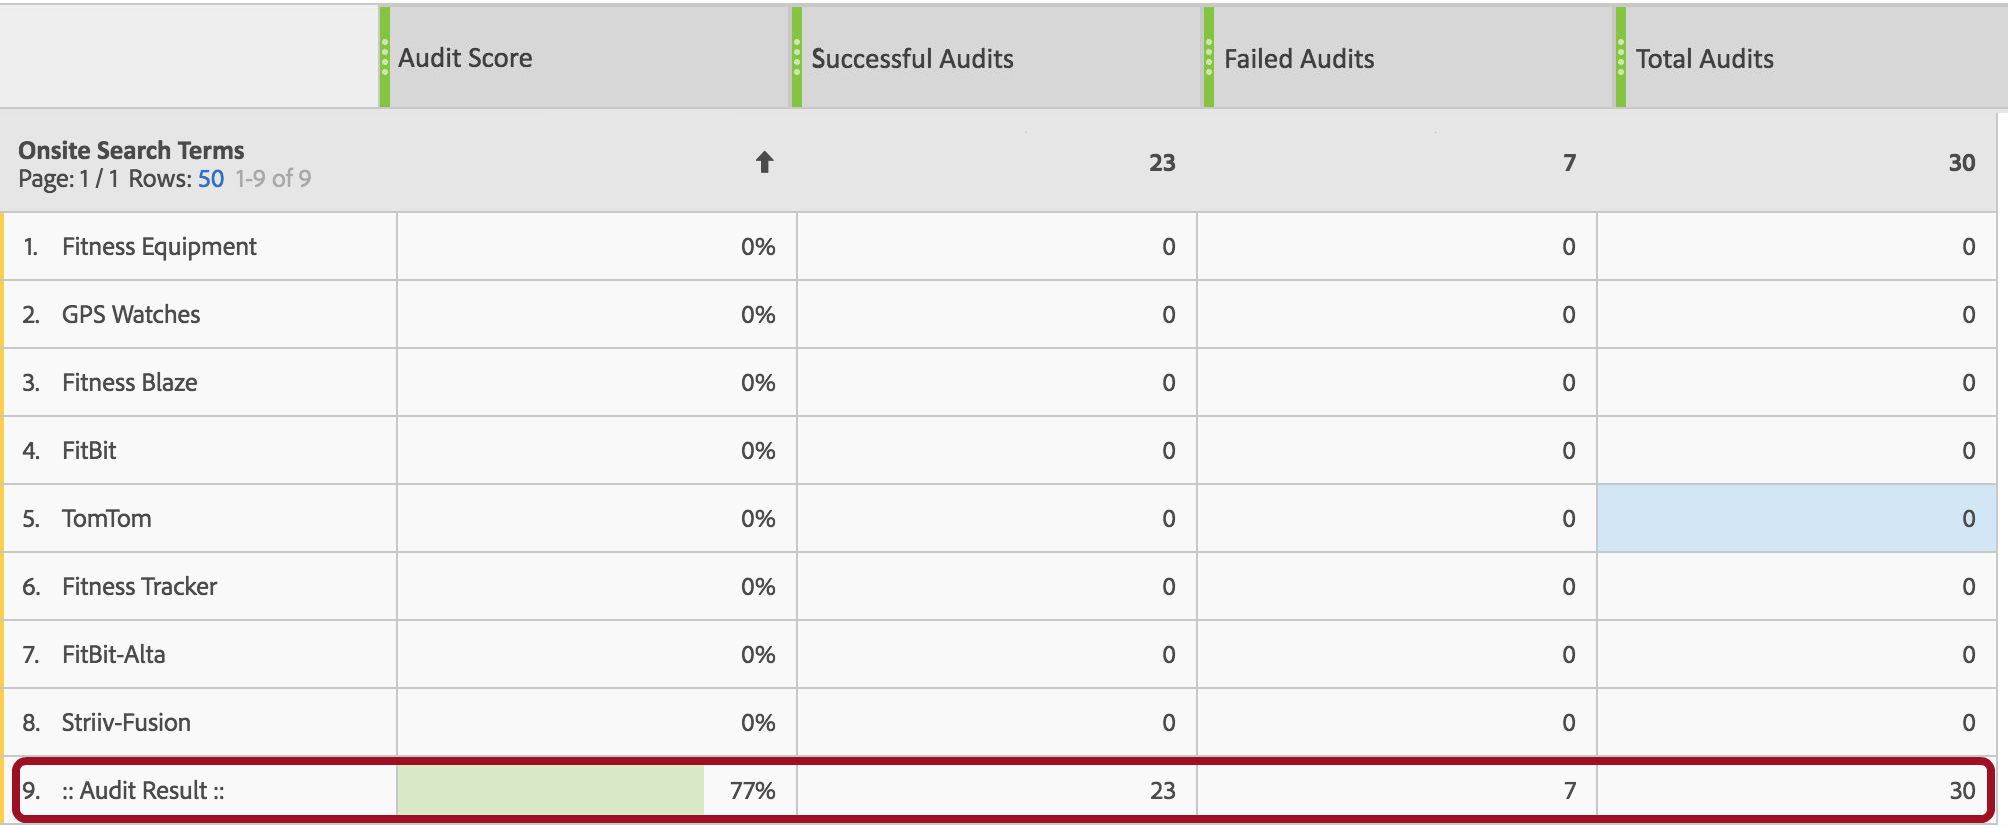
6. You can even add audit data directly in your dimensions as a line item:

These are just some of the ways audit scores can be integrated in Adobe Analytics. If you'd like to learn how to enable similar metrics in your Adobe implementation, or if you have a question about the presented auditing score framework, send us a message or leave a comment below.